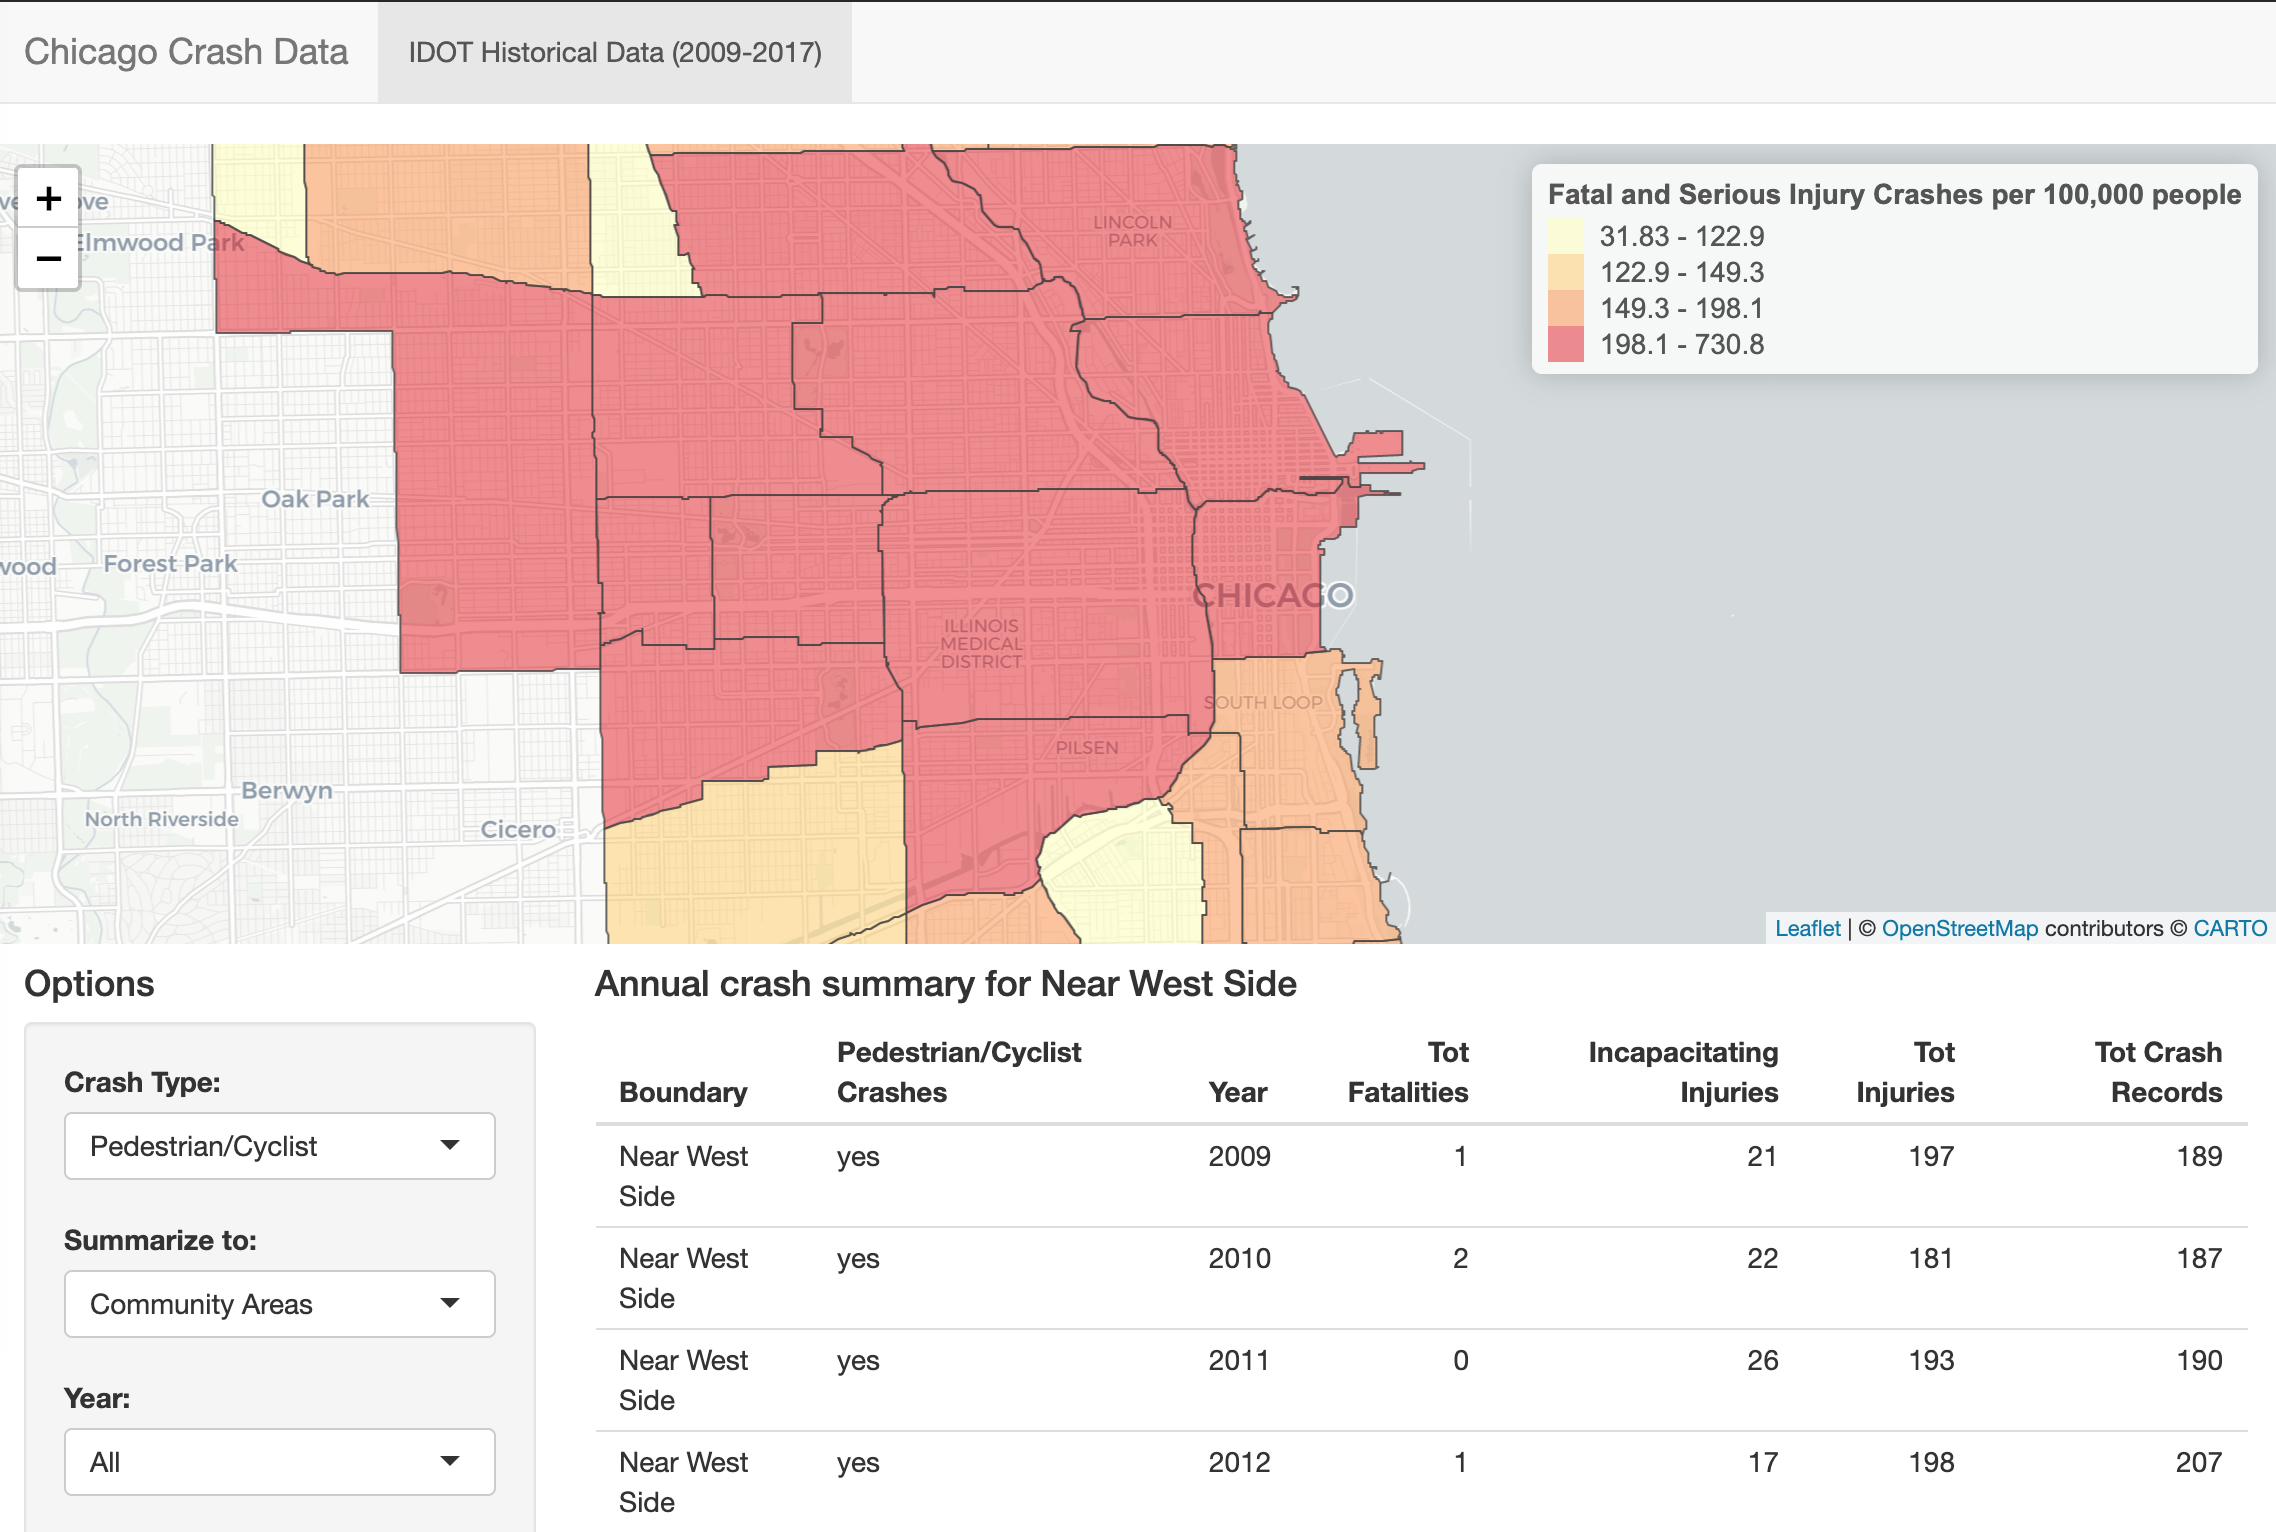
Since I started my master’s project last year, I’ve struggled with the problem that despite collecting thousands of crash reports each year we don’t have good ways of displaying, analyzing, and learning from deadly and dangerous street design.

Today I pushed an update to my Chicago Vision Zero Dashboard project that gathers lots of the data work I did for my master’s project in a way that I hope will save other researchers and curious people time and stress. This dashboard is a Shiny web app, so anyone can work with the data graphically. I’ve also shared some of the R code I used to clean up and re-format the crash data on Github, so other people can use this directly or adapt it for their own use.
View code for Chicago VZ Dashboard on GitHub